Immersive telematic environmentThis page describes the unencumbered immersive telematic environment “radiomap”, created in collaboration with Stephan Huber, a media designer & programer based in Hamburg. The first version of this interactive environment enables one or more individuals to walk about a projected photorealistic image of the Earth (Mercator projection[1], 8x4m) and listen to live internet radio broadcasts that are located at the corresponding locations. The interaction is simple and intuitive. This research project is exploring the experiential qualities of interactive environments, especially those that may be described as creating effects of global awareness, holistic overview of the world and feeling of interconnectedness.
Categories and Subject Descriptors
D.3.3 [Information Systems, Arts and Humanities]: H.5.5.1 Multimedia information systems – Artificial, augmented, and virtual realities, Audio input/output, Evaluation / methodology, H.5.5.2 User Interfaces – Evaluation/methodology, input devices and strategies, interactions styles. H.5.3 Group and Organization Interfaces – Synchronous Interaction, Asynchronous Interaction, Theory and models J.5 Arts and humanities – Fine Arts.
General TermsInteractive installations, interaction principles, unencumbered interaction, psychological effects.
Keywordsunencumbered, immersive, natural interaction, transformation of data into experience, global awareness, insight, presence,
1. Introduction
This interdisciplinary research explores interactive environments that create experiences of presence, global awareness, holistic overview and feelings of interconnectedness and further tries to understand what is necessary to create them. Some aspects of this relate to Telepresence yet there is one fundamental difference; it is not about the illusion of “going there”[2] but of bringing properties of “there” here. Part of the project is trying to understand the relationships between art, science (as inspiration & medium) and the process of making. The artist being inspired by scientific inventions, the process of making and their combined influence upon an audience.
“We need a new medium that will nurture our senses so that we may all be compatible with the natural and cultural diversity of the world. A new world demands a new medium: a medium to develop a new "common sense" regarding our planet, our land, and ourselves.” Shin'ichi Takemura [3]
1.1 Similar approaches: “Sensorium”
In 1997 Japanese artists and scientists formed the group “Project Taos” and created “Sensorium”[4], a collection of installations and web based experiences, all of them based around the general theme of “perception of the living world“. Often their works use real time data as webcam images or weather data and medially transform these into another medium or physically accessible format.
Most of Sensoriums’ projects have in common that they seem relatively simple with very reduced modes of expression. They encourage participants to reflect, discover, and experience; The dialog between visitor and piece is often physical, personal and, where possible, sensuous. All of the projects show a concern for the earth as a habitat and try to raise awareness for it in a rational, cognitively stimulating manner. They begin with something simple and graspable that is pointing to the “bigger picture”, setting the participants in context.
2. Radiomap
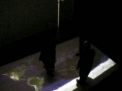
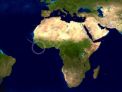
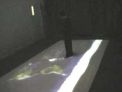
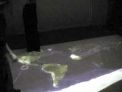
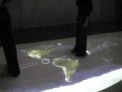
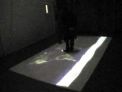
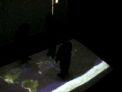
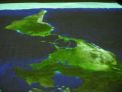
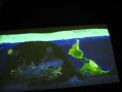
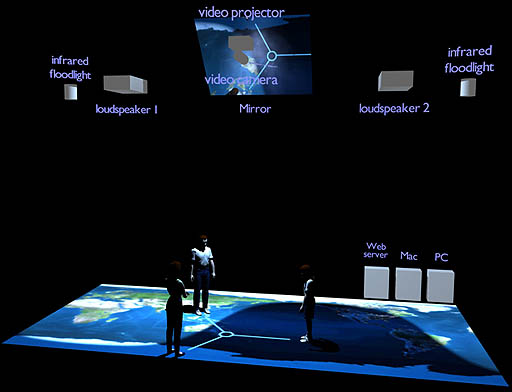
As a platform to create and research experiences of “holistic overview” and “interconnectedness” I have developed “radiomap”, a large photorealistic map of the earth displaying day- and night hemispheres that is projected onto the floor. As participants walk about this map they can listen to live radio programs located at the matching locations all over the world.
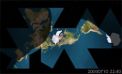
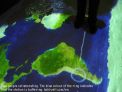
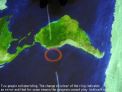
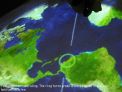
Once a person walks about the “map”, an unobtrusive graphic element is placed into the direction of movement. This ring-line combination is the “Point of Interest” (“PoI”) used to select radio stations. Should more participants enter the space, all their lines connect to the single ring element, creating a shared PoI, which is placed in the calculated middle (mean value) of all participants. Now the individuals have to collaborate to navigate the PoI in a controlled manner. Personal aims have to be agreed with the other participants. This encourages complete strangers to act as a group while exploring the map for radio stations.
As the PoI approaches the location of a radio station its volume gradually increases giving the impression of “tuning in” to it. This auditive feedback, synchronised with the motion of the augmented ring-element and the participants own bodily movement, provides a sense of control and, thus, a more transparent and satisfying experience. If the PoI is located between two or more stations that are relatively close together their signals would mix. This creates potential for surprise or “unintended use” (“mixing”). Yet participants are always able to accurately “tune into” a station avoiding disturbing effects.
Figure 1: Radiomap, three visitors sharing “Point of Interest”
Experiencing the content and local colour of the actual radio programs invokes surprise. The conscious participant realises that it can be 4 pm Wednesday in Newfoundland and 9 am Thursday in Sydney, Australia – at the same “time”! In this interactive environment people become aware of different time zones, weather conditions, Summer and Winter, and the fact that we are living on a globe that is rotating around the Sun.
Disorientation
It was necessary to use a traditional Mercator map as the interface to achieve the desired synchronoptic overview of all time zones and the day and night regions. The photorealistic map used here is created by the application “xplanet”[5] and updated in five minute intervals. Being placed “on” a map instead of being an outside observer, as is usually the case, creates a very unfamiliar and disorienting perspective. Participants’ concept of geography is literally turned upside-down. Initially the desired solution for this “overview effect” would have been Buckminster Fullers’ revolutionary “Dymaxion World Map”[6] displaying the world as “one island in one ocean”. Yet this would have resulted in several conceptual as well as technical difficulties: Primarily participants’ familiar mental-image of the geography of the world is already stressed enough by the effects described above. The unfamiliar “Dymaxion” map would have increased this disorientation to an undesired degree.
3. Artistic motivation
The belief is that those interacting with radiomap may experience a new feeling of being in the world. This may have a lasting effect on their personal stance and sense of place, especially as it is perceived with the senses and by physical interaction and not just passively consumed. I believe, also, that this experience of holistic overview of the world as a whole, the multitude of languages and different dialects of the radio programs and the characteristic that participants have to orchestrate their intentions among each other, may result in a lasting experience of insight and interconnectedness; Not only to each other, but also to the places experienced. A single participant will have a satisfying experience – yet no single individual can dominate a session of multiple participants. The artwork does not try to overwhelm the senses with “loud” or fierce action and response. It leaves place for a critical, personal distance encouraging reflection and contemplation. This may lead to the insight that knowledge is different than experience.
4. Technical details
Radiomap is made with Macromedia’s “Director MX 2004” and runs on two compputers: a Mac that does the video-tracking - and a PC that updates the map and plays the streaming-radio. It requires a fast Internet connection, an appropriate video projector and a video camera both mounted on the ceiling to achieve a large projection/tracking area of 8x4 Meters (with the help of a large mirror). The tracking of participants itself is performed by the Director application using the “trackthemcolors”[7] bitmap tracking plugin (Xtra). Here, changes in successive video frames of the ceiling camera are compared to each other and converted into a persons’ position and direction of movement. These are indicated by an augmented “Point of Interest” (PoI) and a augmented line & ring element that is projected onto the map into the person’s direction of movement. If several participants are detected, their mean distance to each other is calculated and the single PoI becomes shared by all of them. The PoIs’ position is compared to the location of 200 radio stations in the applications database. As the PoI approaches a radio location its audio stream is initiated from the server and becomes audible over two speakers. Its volume increases upon decreasing distance. Proximity to stations and their names are indicated by text and opacity changes of the PoI.
I selected the radio stations included in the database based on a variety of considerations. Among these most important are geographical location and “local colour”. Content “format”, file-format (real audio, WMP, streaming Quicktime, streaming mp3), their bandwidth (quality) and reliability are considered as well. A sole station at the “periphery” is more likely to be included; its content matters less then its geographical location on the map. In areas with larger varieties to choose from, those stations are favoured that have a lively “feel” about them and report about local events, local news and traffic reports rather than just streaming music of a certain genre.
5. REFERENCES
[1] Mercator Projection: http://en.wikipedia.org/wiki/Mercator_Projection
[2] Steve Benford, et.al.: Understanding and Constructing Shared Spaces with Mixed-Reality Boundaries, ACM Transactions on Computer-Human Interaction, Vol. 5, No. 3, September 1998, Pages 185-223
[3] Shin’ichi Takemura: “The Internet as a Sensory Medium for Rediscovering Ourselves and our World” http://www.sensorium.org/faqs/person/takecomment.html
[4] Taos Group: http://www.sensorium.org
[5] “xplanet” by Hari Nair: http://xplanet.sourceforge.net/
[6] Dymaxion map: http://www.bfi.org/map.htm
[7] “trackthemcolors” xtra: http://www.smoothware.com/
|