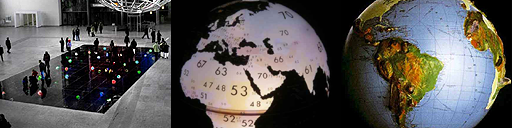
Ingo Günther's Worldprocessor: Life Expectancy, Mountains of Debt.
WorldprocessorSince 1988 Ingo Günther is working an a collection of modified individual globes that augment statistical data in a variety of ways. He has created more than 300 between 1988 and 2005 each depicting one statistic "truth" interpreted in Günther's way. These globes display statistical data such as "distribution of wealth" or "life expectancy" for different countries, creating a staggering awareness of the different conditions of life all over the globe.
Each of the globes bears its own distinct design and physical appearance, each visualising one selected statistical “truth” for all countries of the world. For example, one of these globes, “Distribution of Wealth,” informs us that the 120 million inhabitants of Japan have as much personal income as the 3.2 billion inhabitants of the 62 poorest nations of the world.
The collection of statistics Günther visualised in his globes include the following: energy consumption, life expectancy, toxic imports and exports, holes in the Ozone layer of the atmosphere, military budgets, political prisoners, population distribution, UN peacekeeping missions, production and distribution of land mines, depleted fishing grounds, balance of trade, US industrial waste streams, nuclear explosions, time zones, ocean pollution, ocean polluters, a relief globe with mountains of debt, money geography, airplane disasters, company wealth vs. country wealth, Moody's1 rating, historical diasporas, car populations, world average temperature, Terrorism, DNA traces, water sheds, prison population.
The mostly brightly coloured and translucent globes are exhibited in a darkened space and are illuminated from inside. As visitors wander from globe to globe they become immersed in the numerical data that has been augmented into suggestive visualisations. The work gathers its strength through its contrasting nature that places completely innocuous data such as watersheds besides disastrous ones such as nuclear explosions. Visitors make their individual discoveries and create meaning from the information they experience on their journey through the installation.
Experiencing the information in this way creates a staggering awareness of different conditions of life all over the world.
As visitors wander from globe to globe they create their own connections and meanings from the information, and become aware of the different relationships such as between Educational Spending and Life Expectancy become apparent.
His globes are a manifestation of visualised knowledge showing the fundamental difference between just knowing - and experiencing; Triggered by the transformation of dry facts from one medium to another into a comprehensive format. An example for the power of visualisation.
Günther describes this continuous work as, “navigational aids for the intellectual and emotional comprehension of our world.” 2 He defines the role of an artist as an “informant” and avoids emotions in this work by presenting the data as cold as possible.3 He combines artistic, journalistic and scientific methods and uses globes as presentation mediums for social, political, economic and military information. Through this application he presents a variety of facts and brings them into a powerful visual format. This format allows the individual visitor to make their own associations on their individual journey from globe to globe, creating potentially subversive connections from the accumulated information provided.
|