Approaches to data visualisation/transformation
This area has many different labels depending on the field or discipline that is ascribing it. Sometimes it is described very general as imaging technologies, data visualisation, as "mapping from one sensorial domain to another" or as being "morphologically analogous" occassionally as synaesthetic and some even call it "Non-visual & Multimodal Visualization", the latter the title of a conference in London in 02005.
Essentially it is about the many different ways of organising data in such a manner that we gain new knowledge or insights from it. A common example would be organising dry figures to charts and diagrams which help us to comprehend complex data - yet in a broader sense it also includes more complex processes such as, for example, those mp3 visualisers that create colourful animated visuals sychronised with the music in realtime. Here data is transformed from one sensorial modality hearing into another, seeing, a stupefying and intriguing process, only possible through computer mediation. Transformations such as these may change our whole concept and perception of the world; If we think this a little further a multitude of different useful and playful applications come to mind. The implications for many areas are fundamental and the lack of publications shows how much this area is underestimated.
Many of these transformations - a change of form - as which I would like to describe it from here on, are confinded to the computer screen, but it is the physical space where it really gets interesting.
This page explores the idea that we could and should experience mediated data not only visual or auditive but through all our senses, as temperature, olfactory sense (scent), vibration (mobile phone!). We are multisensorial beings and exist with all our senses in the world! A simple leaf from a tree tells us so much. We know which type of tree it came from, we can tell if it is fresh or wilted and allows for many conscious and subconscious conclusions. Digital artefacts provide little of these qualities, they reach us mostly on a cognitive and rational channel ... and perhaps lately it is also a certain emotional quality to which they apply to.
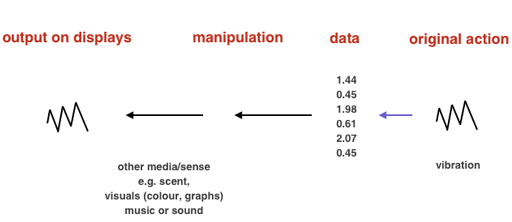
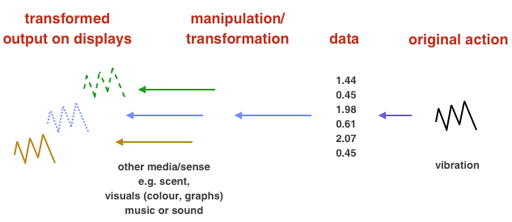
The aim of this design task is to transform remote, abstract and “dry” data into sensual experiences (which is similar to what the German "sinnlich" covers). These data can turn into information through a conscious design process and be used to alter the behaviour, appearance or sound of media installation pieces that themselves can involve, inform or delight individuals in a more sensuous and experiential manner then mere charts, graphs or diagrams can.
Potentially they can make complex and abstract relationships intelligible and tangible.
From an intelligently design bus schedule to software that displays abstract fractal mathematical formulas.
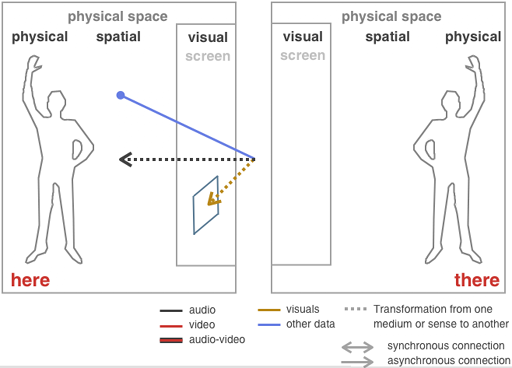
Here we also see the intrinsic relationship to Telematics! While visualisation/transformation has a focus upon the process of how (local or indiscernible) data is transformed from one sensorial modality to another, Telematics has its focus upon time and the geographical distance the data covers. Together they point to a potential area of research where geographical distance, archived or live data, and different display technologies would allow us to learn about remote places in entirely new ways, similar to a airplane cockpit where all information flows together.
With my background in design it is all about making data intelligible and comprehensive by turning it into useful information. This may be a bus schedule or a wayfinding system: With all utalitarian design that fullfils a strict function i think it should work like an old-school gentleman being dressed. You do not remember what he wore. When one has to think to "read" a bus schedule the designer has done something not quite right. In that respect it is rooted in the domain of graphic-design, which has been traditionally concerned about visualising data.
The media-adequate transformation of data into experiences is a crucial point in these explorations. Not every medium is useful for every type of data. In some cases it might make more sense to make a book instead of a website, sometimes a film serves the purpose better then an elaborate CD-Rom. The rules vary from data type and purpose. In fact there aren't any rules.
Another aspect of this transformation is the idea to bring "life" and sensousness into the realm of the digital, proverbial "cold" and "abstract", that have become almost synonyms for "technical".
It does so by describing attributes of everyday objects and comparing their qualities to those of computer user-interface properties. As the use of computers has shifted from being a tool for a few, to a (mass) medium for many, expectations towards technologies have changed and what has been accepted by many until now is not satisfactory anymore. It encourages "Users" to get involved, realising that they are not technological illiterates but that interfaces are clumsy. Which is a question of design.
Therefor this page also encourages multidisciplinary collaborations among people from different backgrounds, artists, musicians, architects, computer specialists, designers and others.
This page describes four different approaches of use of the internet beyond traditional World Wide Web projects: Transforming real world actions to the web and vice versa. Mapping real world actions to the real world. Mapping web actions to the real world and transforming web processes back to the web. In general these projects are medially transforming remote activities into dynamically animated visuals with additional sensuous (e.g. “musical”) output – and vice versa. Mostly they are technically not trivial and require skills from different disciplines such as computer programming, architecture, design, music and the visual arts.
These four documented approaches are serving as examplary cases only and numerous other varieties are conceivable. Tranformation is the same process that Lev Manovich calls "mapping from one domain to another". It think it is a transformation as it takes shape in another form.
As more and more information reaches us via computer mediation this is a development that should not be underestimated. It is a challenge for all the disciplines involved especially those of information visualisation, information architects, HCI and interface design. In the past this involved graphic-designers which are educated in creating maps, charts and diagrams. In the future this will involve all the other senses, and too little attention is given to this at the moment.
|